Get a clear overview of your gym’s performance with real-time data into member activity, revenue trends, class attendance, and staff productivity. Easily filter reports by date, gym location, membership type and much more to make data-driven decisions.
Organise reports into visual charts and grouped views to track business growth, identify opportunities for improvement and offer your climbers the best possible experience!

Introduction video to the BETA Reporting Dashboard is coming soon!
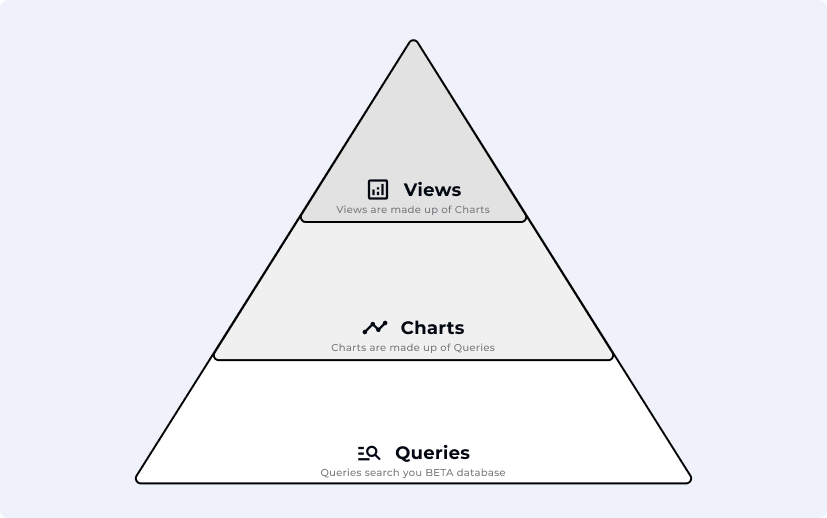
Queries are the building blocks of data on the platform. Once a query is created, it can be visualized into charts, and those charts can then be grouped into views.
Queries: The base of all data, these queries once created should not be edited - unless you want to change the underlying data you are querying. eg: a query of all new members
Charts: A way to visualize your queries individually or together by grouping them into a single chart. eg: a chart that overlaying three queries of: New members, continuing members and churned members
Views: A view arranges multiple charts on a dashboard with a shared date range. eg: a View dedicated to all of your charts tracking the health of your members.
Queries can also be edited or duplicated (saved as new), and any edits will be automatically reflected in the linked Charts and Views.
A Query is a set of filters and rules that pulls raw data points from your BETA database (e.g., “forms signed in June”).
In BETA, there are three main query types:
A Standard Query
A Compound Query
A Custom Query
These can further be divided into query categories, depending on what we want to see:
Climbers Query
Sessions Query
Products Query
Totals Query
No need to build queries from scratch as BETA provides a collection of pre-built standard queries. These ready-to-use queries help your team quickly access detailed insights into key performance areas.
Create and edit fully customizable queries at any time to suit your specific needs. These flexible tools empower you to explore your data in depth - whether you're tracking performance trends, analysing member behaviour, or evaluating operational changes. Dive as deep as you need to, whenever you need to.
Combine two or more queries, and perform mathematical calculations such as addition, subtraction, multiplication, or division.
Climber queries count unique profiles. Use this when you're interested in how many individuals meet certain conditions.
Example, How many climbers have a “10 punch pass”? How many climbers signed a document?
Sessions queries count visits. Use this when you're interested in how many visits meet certain conditions.
Example, How many sessions on a “10 punch pass”
Product queries for ****when you want to track product activity (what was sold). Chose this type when you are interested in how many of a specific product.
Example, How many 10 punch passes were refunded? How many cakes were sold?
Totals queries sums financial data. Use this type when you want to understand total revenue.
Example, How much revenue was generated on sales “10 punch pass”? How much in refunds was processed for the category? How much money did I make in cake sales?
Each query can be customized using filters. Filters define which part of that data you want to look at and help you narrow down the data to exactly what you need.
Example, Filter A Totals query, by product type, demographic, registration method, and more. See a full list of filters below.
Tag
Type
Expiration/Validity
Documents
Forms
Expiration/Validity
Demographics
Min/max age
Gender: None, male, female and other
Family Status
Family Role: Admins/dependants
Min/max family size
Passes
Entry type
Duration of validity
No. guest entries
No. entries
Events
Template
Transaction
Product
Discount
Type of transaction
Location of transaction: Online, POS, In-app, Subscription
Attendance
Type of entry: Pass, Guest, Non-guest (passholder)
No. entries
Slots
Type of entry: Pass, Guest, Non-guest (passholder)
No. entries
Climbs
Type of entry: Pass, Guest, Non-guest (passholder)
No. entries
You can generate a query with owner permissions only.
To access the reporting page, please go to Insights page on your BETA dashboard and find the Go to reporting page button on the right top corner of the filters` function.
Looking for examples of Standard Query set-ups? Please visit the article below.
Standard Queries: Set Up & Examples
Dive deeper into generating Queries using our ready-to-use templates.
Filters & Customization
Use filters within queries to drill into specifics
Save filters for easy reuse
Set default time periods within your created Views
Queries Are Easy to Edit
Modify existing queries anytime using the Edit button
Create new versions of the same query via the Save as New button - great when working with many filters
Looking for examples of Custom Query set-ups? Please visit the article below.
Custom Queries: Set Up & Examples
This help article provides an overview of the most common custom queries a gym might need to streamline day-to-day management, track member activity, monitor attendance, analyse performance metrics.
Combine queries using a compound query to layer data (e.g., compare two datasets)
To delete a query, open it and select the "Delete" option. Once deleted, the query will be permanently removed and will automatically disappear from any charts it was linked to. This action cannot be undone, so make sure it’s no longer needed before deleting.
To edit a query, open it and make the changes you need, such as adjusting filters, columns, or date ranges. Once you're done, click "Save" to update the existing query.
If you edit a query and save as new, it is important to change the naming of that query for clarity, especially when dealing with different metrics.
If you want to keep the original, use "Duplicate" instead and save your changes as a new version › Duplicate a Query in the same gym.
If you want to make slight changes to an existing query and save it as a new one, you can duplicate it. Open the query you wish to copy, then use the "Duplicate" option.
This will create a copy that you can rename and modify without affecting the original.
To duplicate a query to another location, you need to be in the parent location—such as the main gym—in order to view and copy queries to any child locations.
If the destination gym already has the same query set up, the system will not show the option to move it there. Currently, charts do not have a way to be copied, so you will need to recreate them manually.
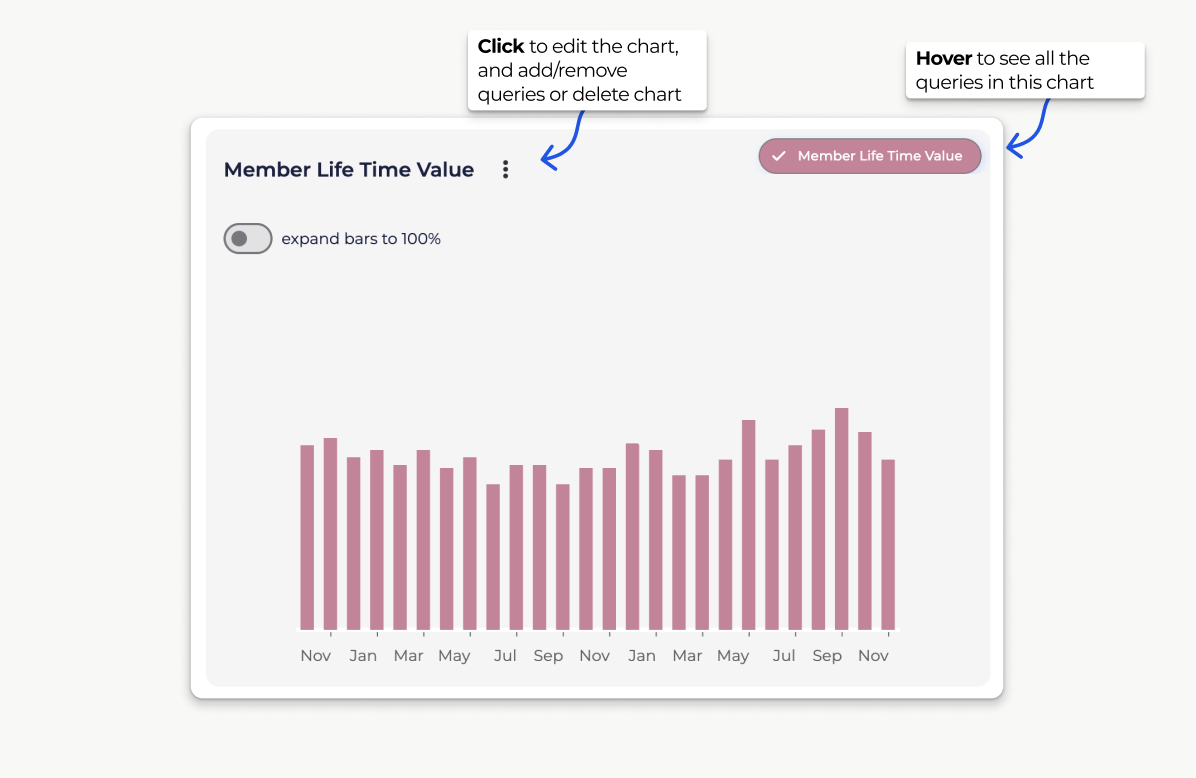
A bar chart displays data using rectangular bars, where the length or height of each bar represents the value of a category.
Example, Comparing Member LTV
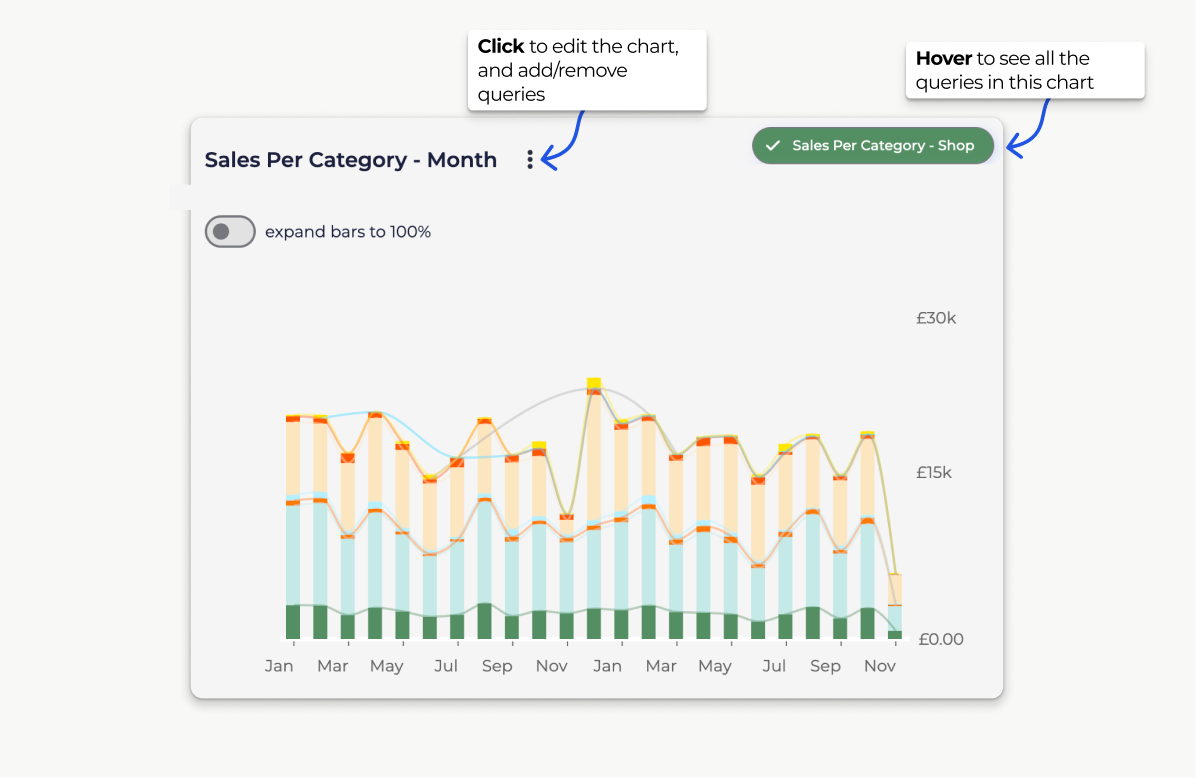
A bar chart displays data using rectangular bars, where the length or height of each bar represents the value of a category.
Example: Sales per category, grouping multiple Total Queries in one chart
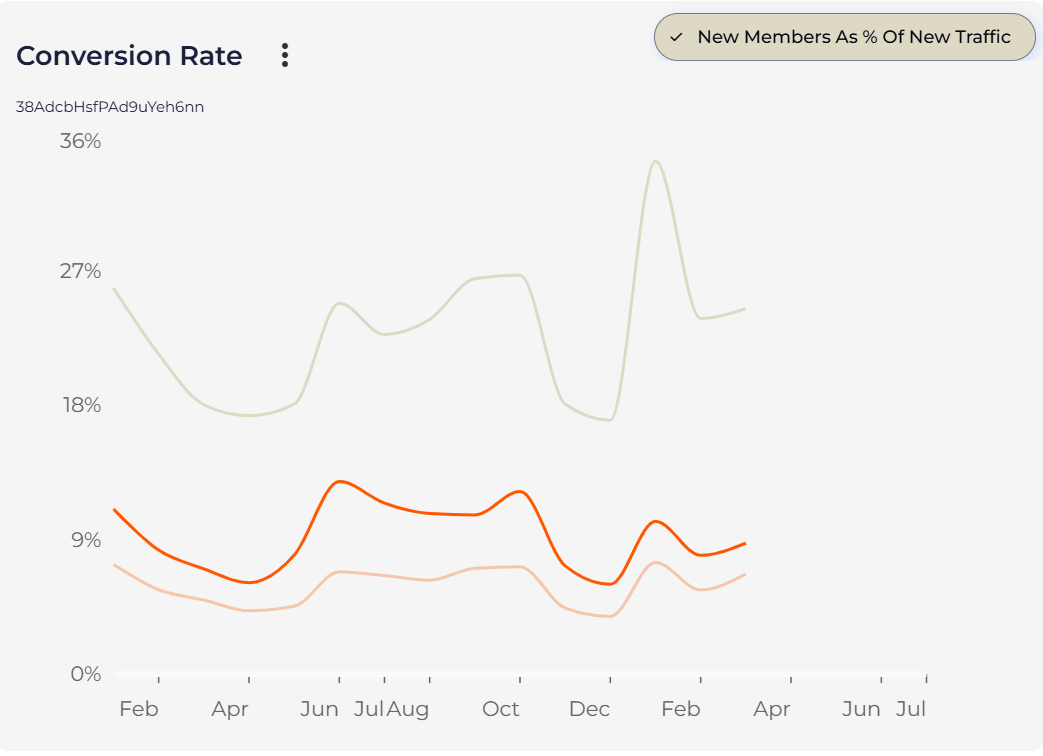
A line chart connects data points with straight lines, showing trends or changes over time.
Example, Use to track visitors conversion rates.
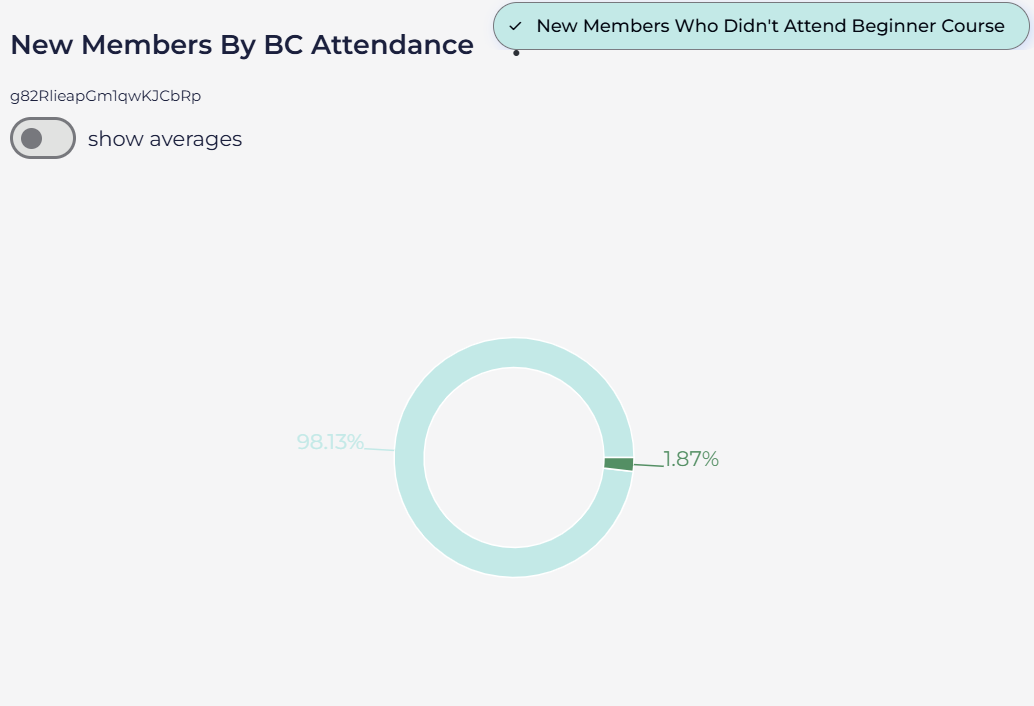
A pie chart divides a circle into slices to show how different parts contribute to a whole.
Example, Displaying the percentage share of visitor types towards an event attendance.
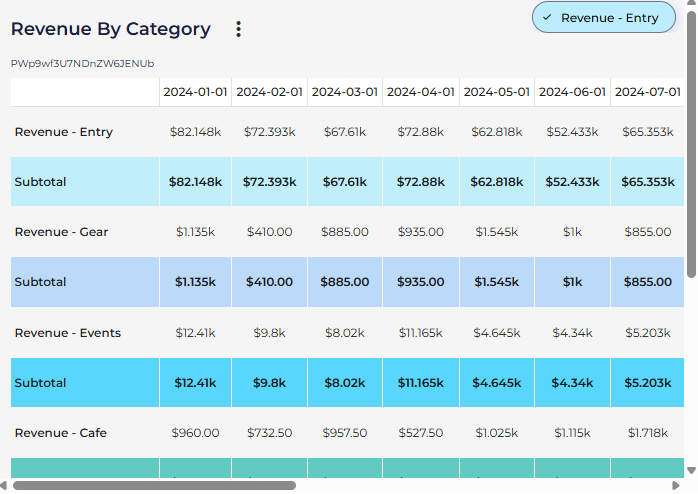
A table organizes data in rows and columns, allowing precise numerical values to be displayed without visual abstraction.
Example: Listing detailed sales data for products (e.g., exact revenue by category)
A way to visualize your queries individually or together by grouping them into a single chart.
Reporting charts can be used to visualise one query or several queries group together. These can be:
several queries from the same category (e.g., climbers queries only)
several queries from different categories (climbers and totals queries together)
To change the data you are seeing without permanently removing or adding a query to your chart, you can click on the queries already added to the chart to add and remove from the current visualisation.
To permanently edit a chart, simply click on the Edit button. This will allow you to change the chart visualisation type, to remove a query that was already included, or add a new one that you have just created.
A view arranges multiple charts on a single dashboard, with a flexible shared date range - perfect for weekly team meetings or role-specific KPI checks.
Each view comes with a default time period, so the data always opens with the right context.
Views are especially useful for weekly meetings or team-specific dashboards. For example, marketing might focus on leads and conversions, while the events team might focus on attendee trends. We suggest views to be bookmarked via URLs for quick access.
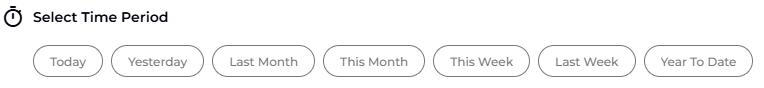
View’s default time period can be easily changed via the view itself. Use the time filter to set a custom time period:

or select from the available time buttons:

You can click Edit on each view to:
rename it
change the default view size
change the width of charts
remove a chart
add a chart
Please note: You can customise what queries are included in the charts within your view, even after the view has been created. Clicking on each query will either remove, or add it to the chart. If a query has a small tick icon next to it, then it is already included in the chart you are viewing.
You can easily delete views via the Delete button.
….Please forward any questions to the BETA team….
BETA offers two main ways to view and analyse your data: Insights and Reporting.
Each serves a different purpose, depending on how you want to use your data — whether it’s for quick checks, or for long-term strategic KPI analysis.
One of the most important things to understand is how often your data refreshes:
Insights are updated in real time. If you're using Insights to check daily sales, view activity in a product, or monitor registrations, you’re seeing the most up-to-date information available. Anywhere you see the Insights button ( ️), the data is live and continuously refreshing. Av
Reporting, on the other hand, pulls from a larger, historical database (including migrated data). This makes it ideal for tracking long-term trends and KPIs. Because of this, some reporting data may be delayed — in some cases, up to 24 hours from the last time it was viewed.
 Tip: If you're ever unsure where to look, just ask: Do I need this data now, or am I trying to track something over time? Insights for real-time answers, and Reporting for deeper analysis.
Climbers
These queries focus on individual profiles — they answer the question relating to “How much climbers ____?”. e.g., tracking their activity, progress, or engagement over time. Use Climbers queries to analyse behaviour like attendance patterns, membership duration, or performance improvements.
Sessions
Sessions queries look at visit data. — they answer the question relating to “How many times did climbers ____?”. They help you understand how often and when members are using the gym. Ideal for analysing peak hours, class popularity, or usage trends across different times or days.
Products
Product queries focus on what's being sold— they answer the question relating to “How much products were ____?”. e.g., memberships, class packs, merchandise, etc. Use these to track sales performance, identify best-selling products, or monitor revenue trends tied to specific offerings.
Totals
Total queries return financial data — they answer the question relating to “How much revenue ____?”. They aggregate data across different categories to give you a snapshot of overall performance such as total revenue, number of sessions, or member count within a selected time frame.
All charts in the Reporting Dashboard update only when someone opens the Reporting page and more than 24 hours have passed since the last refresh. If you view the report again within that 24-hour window, it will show the same data until the next automatic update.
For example, if you open the report at 3:00 PM on Monday, it updates then. If you check again later that same day (e.g., at 8:00 PM), you’ll still see the same data. However, if you open it again at 3:01 PM on Tuesday or later, it will automatically refresh with the latest figures.
In BETA, historical transactions are not be visible under climbers’ profiles.
Attention: Migrated data has the same limitations of your previous software - data in BETA is a lot more granular than migrated data!

Still Lost? We’ve got you covered!
Use the search box on the main Help to search the entire list of available help guides, or drop your question in the Support Chat!