Queries provide a powerful way to access and filter data within BETA to generate reports and gain insights about your members, sales, staff and much more.
You can either use this BETA tool to generate custom or compound queries tailored to your gym's needs, or select from a range of our standard, ready-to-use queries available.

To understand what is a Query in BETA, as well as gain insights into the Query Types & Categories you can use, please read the full Reporting Dashboard Explainer.
🔗 The Reporting Dashboard Explainer
https://www.notion.so/beta/Reporting-Dashboard-Explainer-21116cc94ed480768b9cf8fc062a5925
If you frequently run the same types of reports, save your filters for easy access. In the Advanced Sort , you can create and save commonly used filters. For example, “Members” - for saving all Entry Types that constitute a “member” This helps you quickly apply the same criteria across multiple queries without setting them up each time.
The below guide focuses on the Advanced SORT and it’s filters.
Download climbers’ data with Advanced SORT
Download climbers' data using Advanced SORT to filter and segment your audience easily. This guide helps you understand queries, templates, and attendance tracking.
Using subscription-based queries gives a more accurate picture of engagement, retention, and growth for your recurring pass holders. The examples below show you a few of the possibilities.
This custom query tracks profiles with a specific entry type during a given period who did not have it in the previous period. It helps monitor the growth of recurring subscriptions.
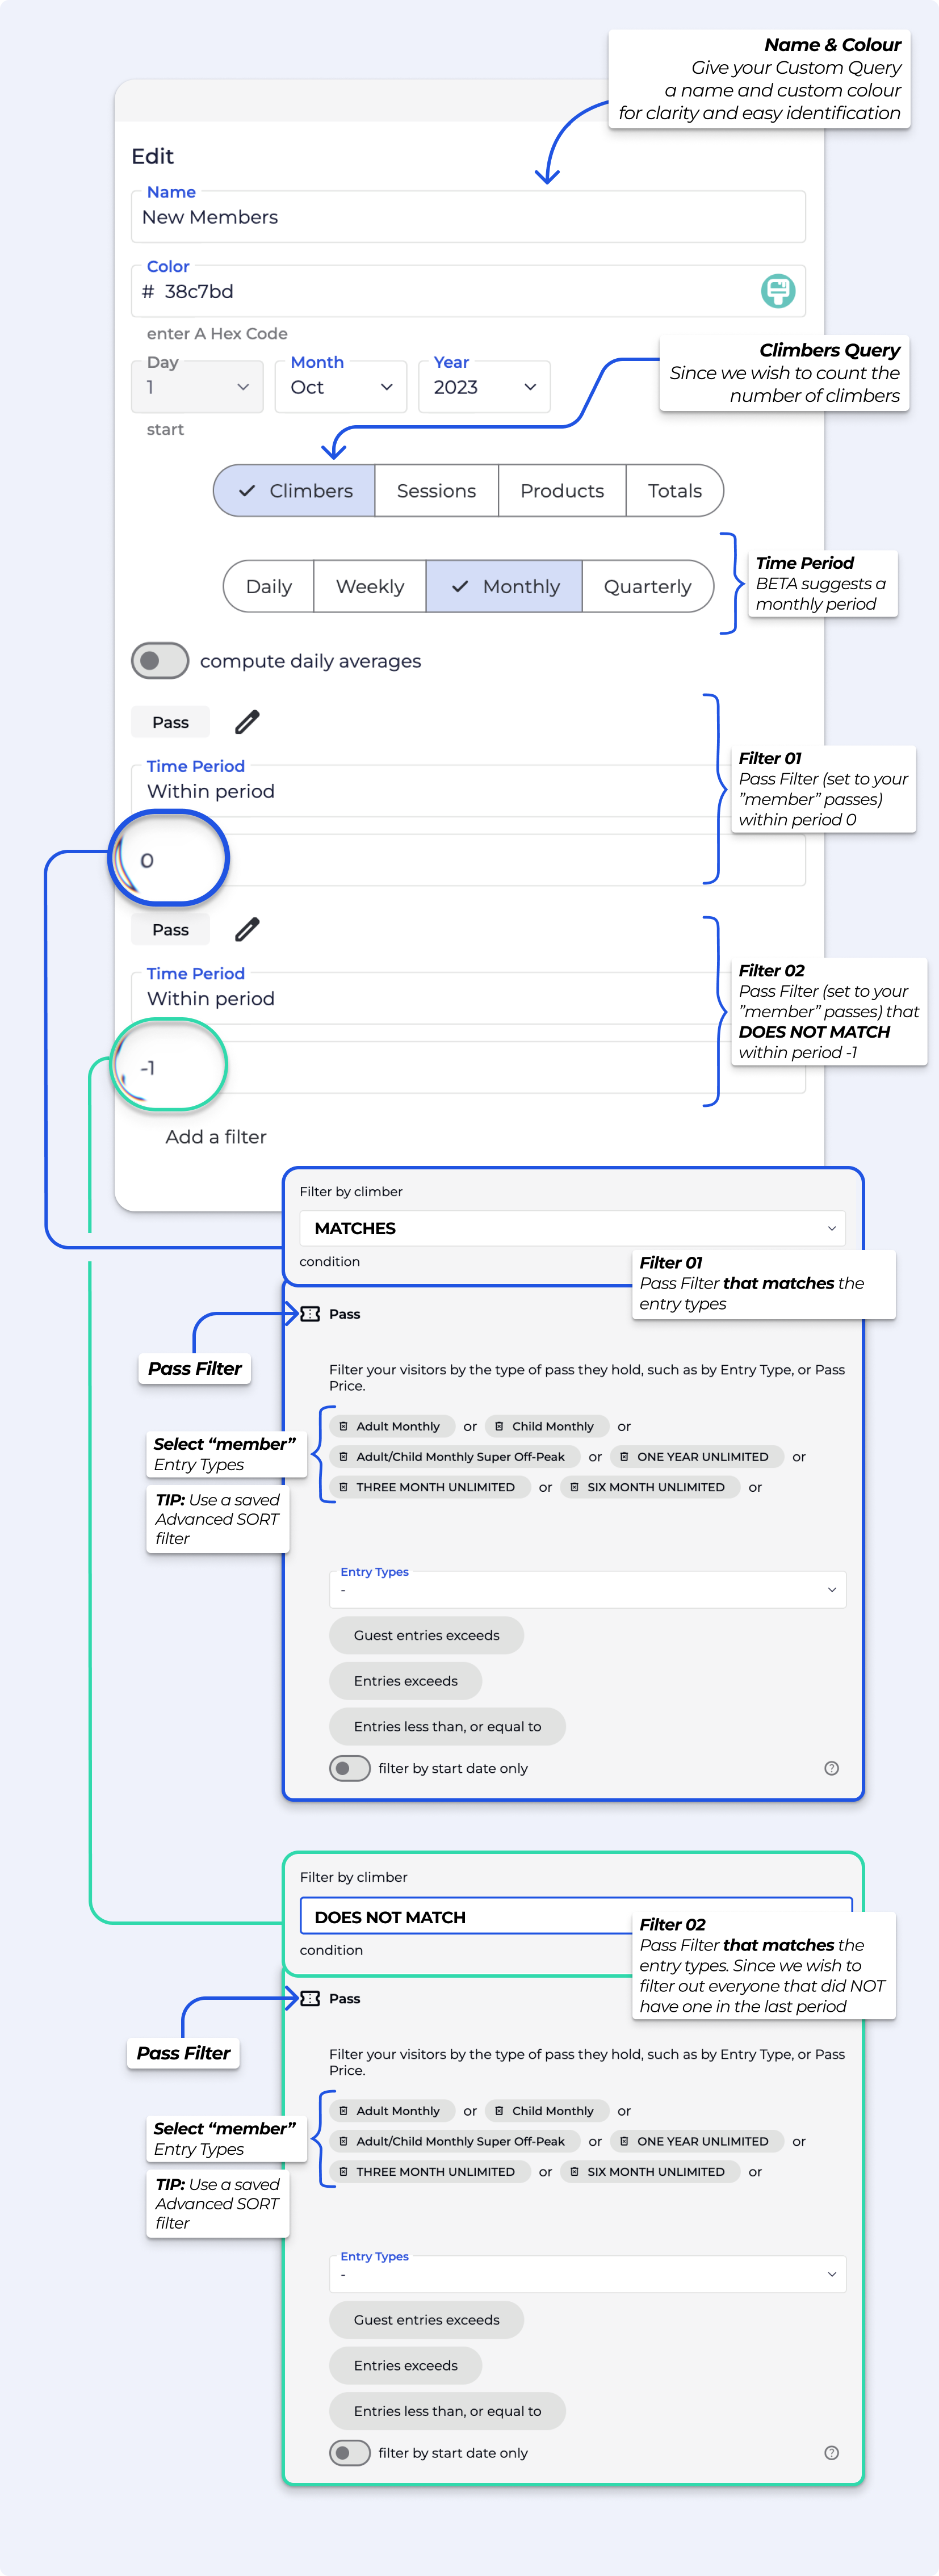
This custom query tracks profiles with a specific entry type during a given period who did not have it in the previous period, based on subscription transactions only. It helps monitor the growth of recurring subscriptions.

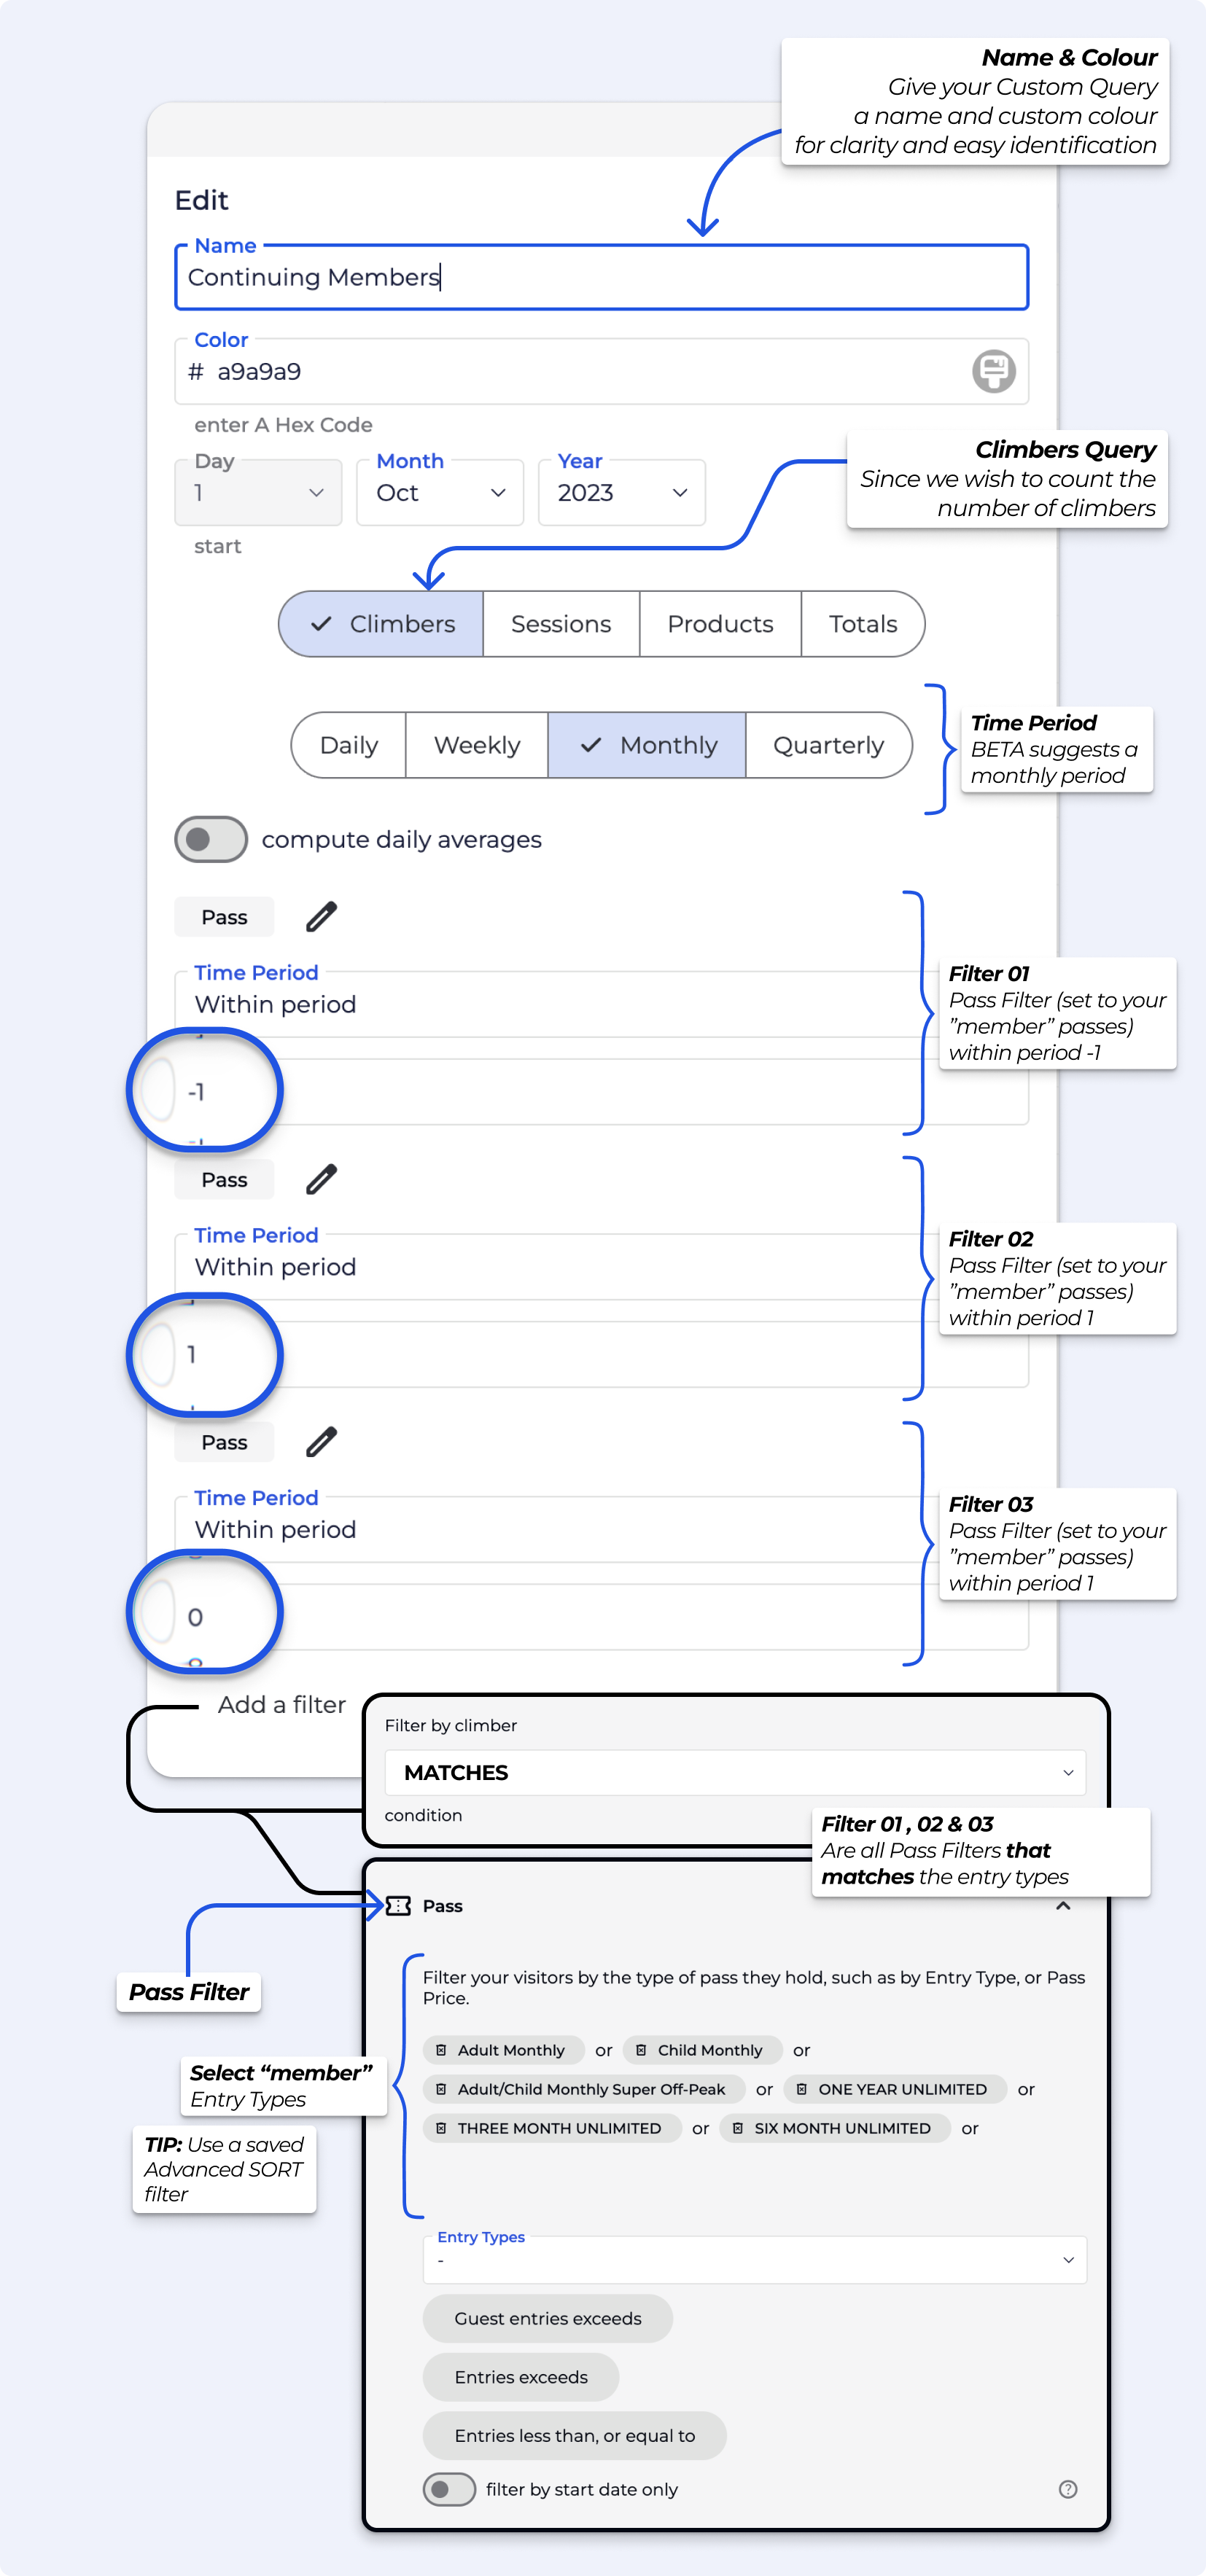
Below is an example of “How many climbers visited the gym consistently over 3 months?”
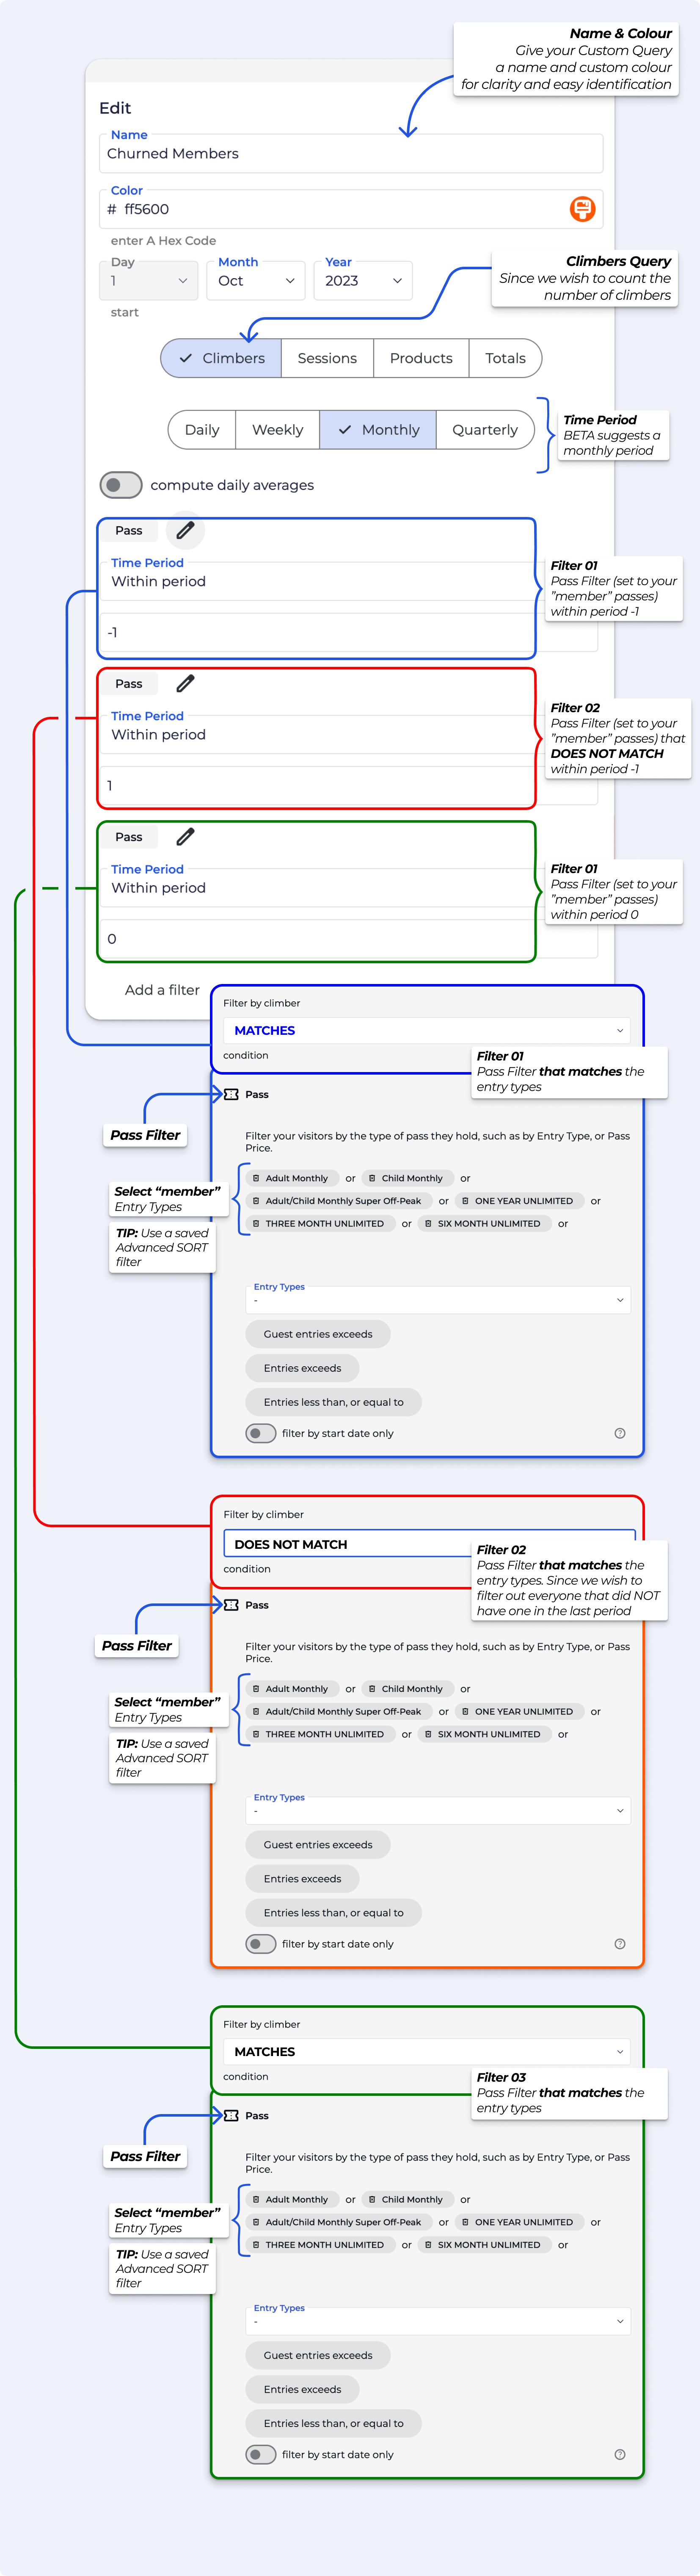
This metric tracks profiles who had a specific entry type in the previous period but do not have it in the current period, using subscription transactions only. It helps identify lost recurring subscriptions.
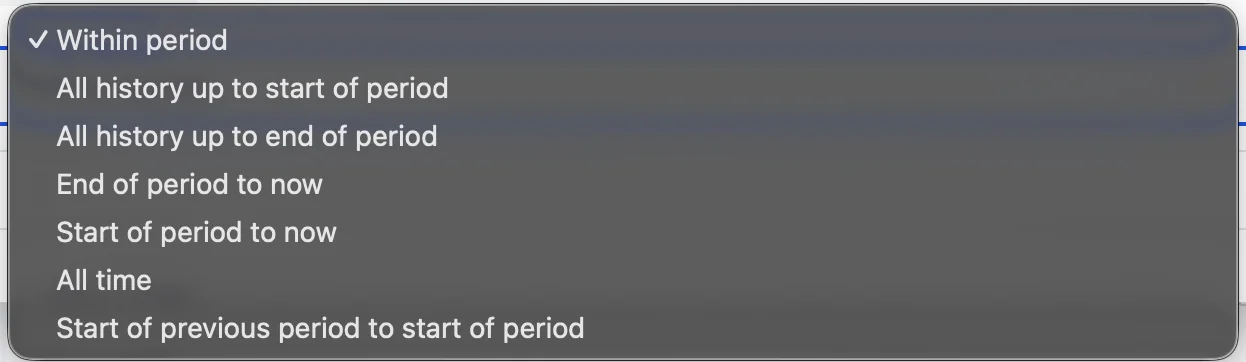
Time period filters allow you to look at values like customers, sessions, products, or totals over different time periods. They help you answer questions about activity in one period, across several periods, or over time.
With these filters, you can see things like:
How many values appear in all selected periods
How many values have happened up to a certain period
How many values happen from a period until now
How many values appeared in previous periods
These filters work with any time unit - days, weeks, months, or quarters - and with any metric you want to measure.
This time period filter counts a value only if it appears in all selected time periods. You can choose how many periods are checked (for example 1, 2, 3, or more). A value is included in the result only if it exists in every one of those periods. If a value is missing in any selected period, it is not counted. It helps you see consistent or repeating activity over time.
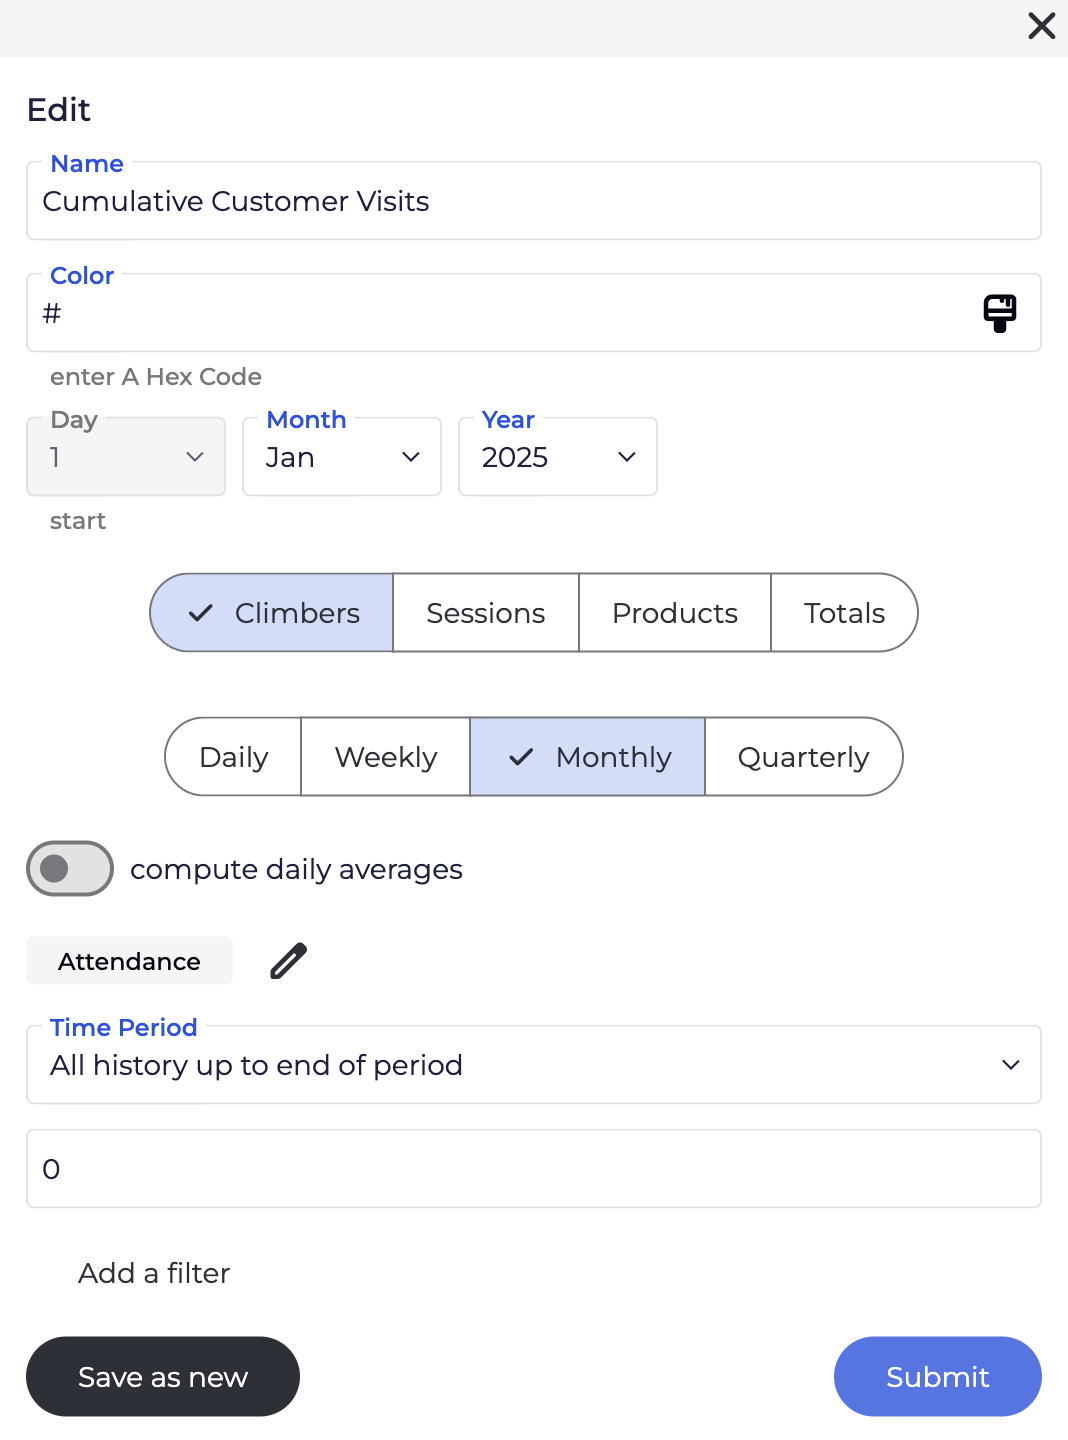
This time period filter counts all values from the beginning of the data up to the selected start/end of a period. All values that appear within this time range are included in the result. This filter helps you see the total activity accumulated over time, not only activity inside a single period.
“How many customer visits happened up to and including this month?”
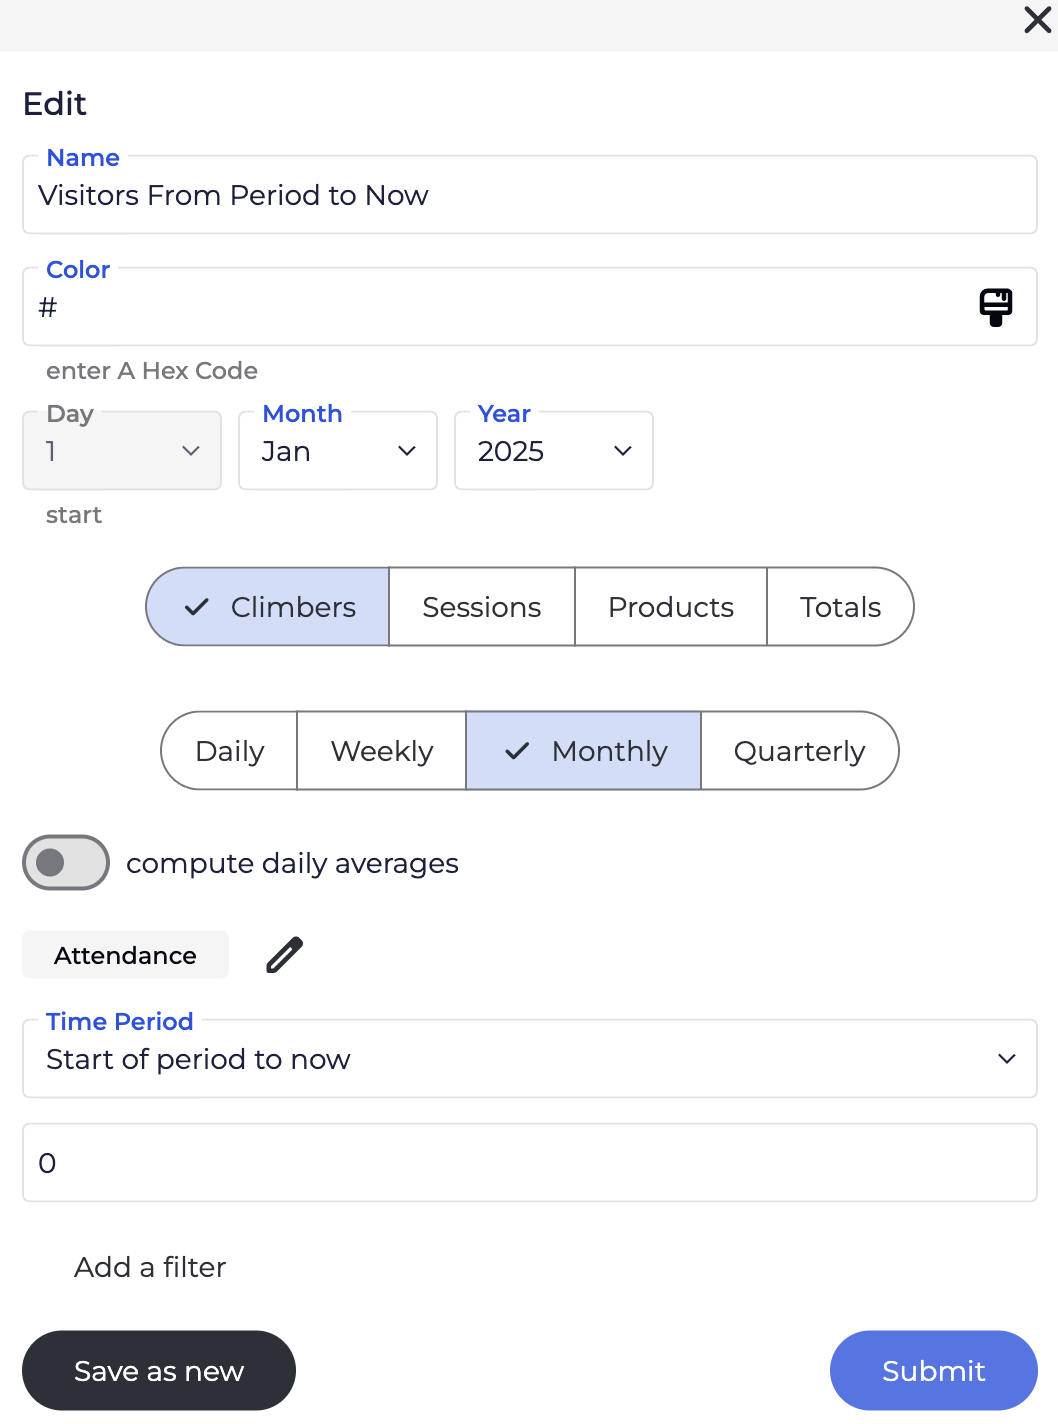
This time period filter counts all values from the start/end of a selected period up to the current time. Each value is counted only once, even if it appears in multiple periods. This filter helps you see future or ongoing activity starting from a specific period, not only activity inside that period.
“How many climbers visited starting from this period until now?”
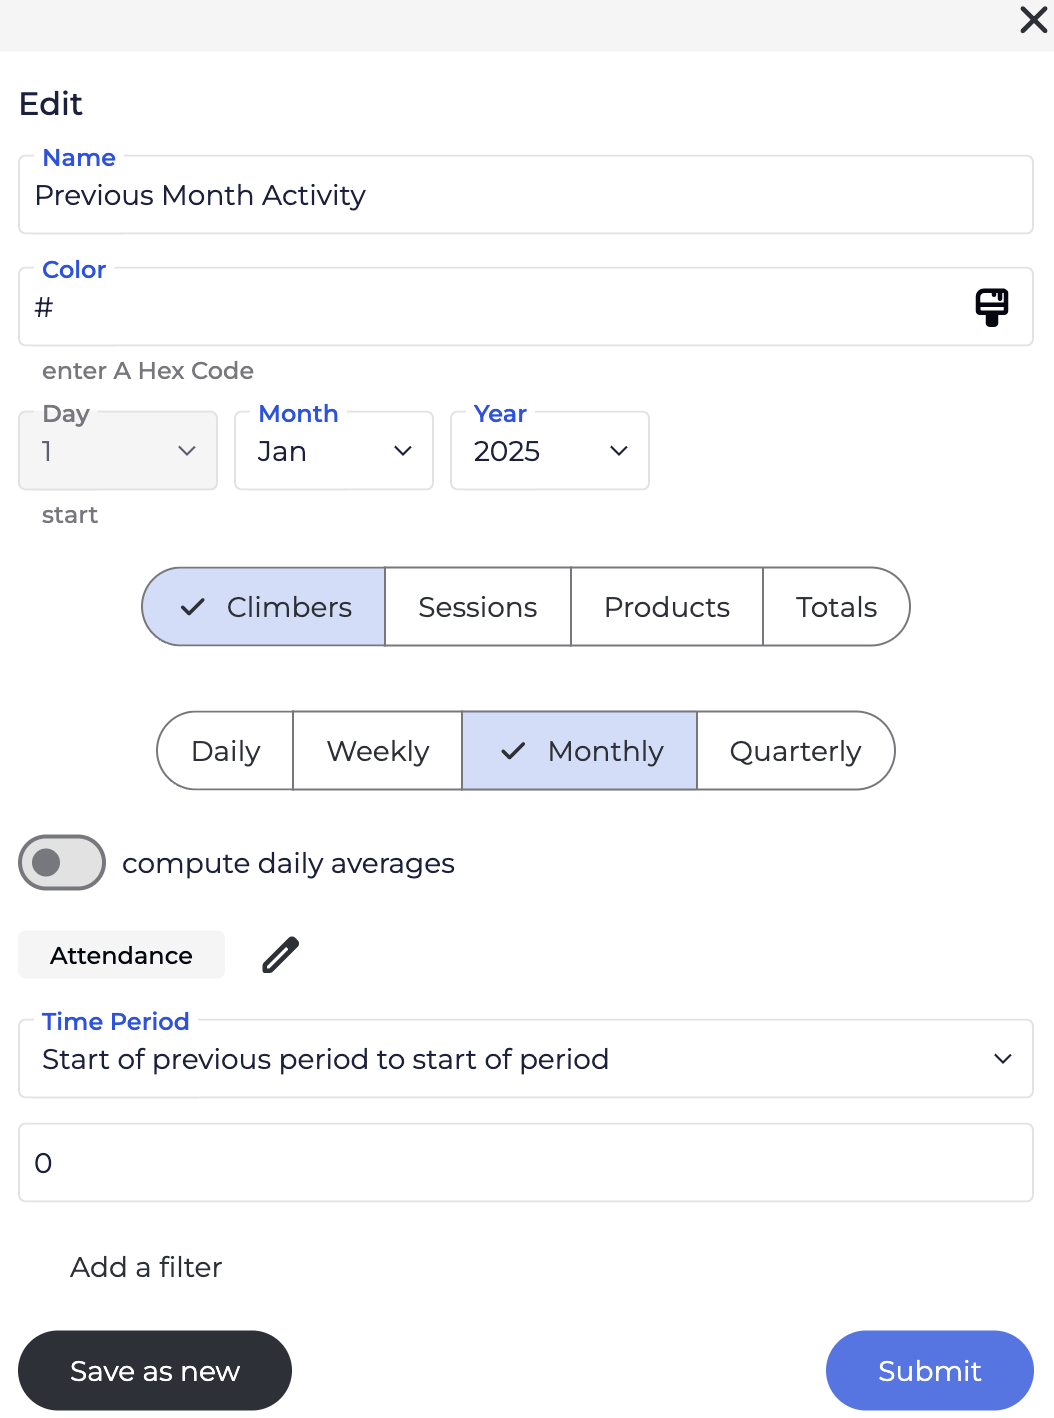
This time period filter counts all values that appear between the start of the previous period and the start of the current period. Each value is counted only once, even if it appears multiple times during that range. It helps you see activity from the previous periods, not including the current period.
“How many climbers visited gym last month?”
BETA offers two main ways to view and analyse your data: Insights and Reporting.
Each serves a different purpose, depending on how you want to use your data — whether it’s for quick checks, or for long-term strategic KPI analysis.
One of the most important things to understand is how often your data refreshes:
Insights are updated in real time. If you're using Insights to check daily sales, view activity in a product, or monitor registrations, you’re seeing the most up-to-date information available. Anywhere you see the Insights button ( ️), the data is live and continuously refreshing. Av
Reporting, on the other hand, pulls from a larger, historical database (including migrated data). This makes it ideal for tracking long-term trends and KPIs. Because of this, some reporting data may be delayed — in some cases, up to 24 hours from the last time it was viewed.
 Tip: If you're ever unsure where to look, just ask: Do I need this data now, or am I trying to track something over time? Insights for real-time answers, and Reporting for deeper analysis.
Climbers
These queries focus on individual profiles — they answer the question relating to “How much climbers ____?”. e.g., tracking their activity, progress, or engagement over time. Use Climbers queries to analyse behaviour like attendance patterns, membership duration, or performance improvements.
Sessions
Sessions queries look at visit data. — they answer the question relating to “How many times did climbers ____?”. They help you understand how often and when members are using the gym. Ideal for analysing peak hours, class popularity, or usage trends across different times or days.
Products
Product queries focus on what's being sold— they answer the question relating to “How much products were ____?”. e.g., memberships, class packs, merchandise, etc. Use these to track sales performance, identify best-selling products, or monitor revenue trends tied to specific offerings.
Totals
Total queries return financial data — they answer the question relating to “How much revenue ____?”. They aggregate data across different categories to give you a snapshot of overall performance such as total revenue, number of sessions, or member count within a selected time frame.
All charts in the Reporting Dashboard update only when someone opens the Reporting page and more than 24 hours have passed since the last refresh. If you view the report again within that 24-hour window, it will show the same data until the next automatic update.
For example, if you open the report at 3:00 PM on Monday, it updates then. If you check again later that same day (e.g., at 8:00 PM), you’ll still see the same data. However, if you open it again at 3:01 PM on Tuesday or later, it will automatically refresh with the latest figures.
In BETA, historical transactions are not be visible under climbers’ profiles.
Attention: Migrated data has the same limitations of your previous software - data in BETA is a lot more granular than migrated data!

Still Lost? We’ve got you covered!
Use the search box on the main Help to search the entire list of available help guides, or drop your question in the Support Chat!